Consider the data in Figure 46.8 illustrating the age structure of France and India. 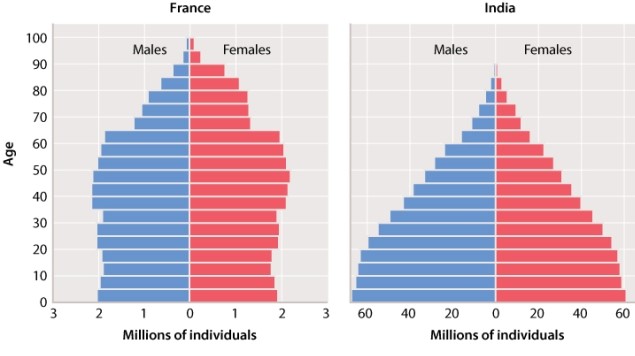 In many parts of the world, the average age of reproductive maturity is increasing as humans move from urban to rural environments. Suppose that the current average age of first reproduction is 15 years old in India and 20 years old in France. How would a 5-year increase in the average age of reproductive maturity in both countries be expected to affect the per capita birth rate, and would this effect be greater in France or in India?
A) increase in per capita birth rate, greater effect in India
B) increase in per capita birth rate, greater effect in France
C) decrease in per capita birth rate, greater effect in India
D) decrease in per capita birth rate, greater effect in France
Correct Answer:
Verified
Q73: Giant clams synchronize their reproduction with the
Q74: Natural populations are affected by both density-dependent
Q75: Consider the data in Figure 46.11
Q76: If having large numbers of offspring results
Q77: The following age pyramid was determined from
Q79: Consider the data in Figure 46.11
Q80: A K-strategist will typically:
A)produce relatively few offspring.
B)produce
Q81: Based on mortality rates shown below
Q82: _ is the proportion of individuals of
Q83: Females for many species vary in the
Unlock this Answer For Free Now!
View this answer and more for free by performing one of the following actions

Scan the QR code to install the App and get 2 free unlocks

Unlock quizzes for free by uploading documents