The red curve in the graph below shows O2 saturation in normal conditions and the blue curve to the right shows O2 saturation in someone with carbon monoxide poisoning. You can determine from this curve that carbon monoxide: 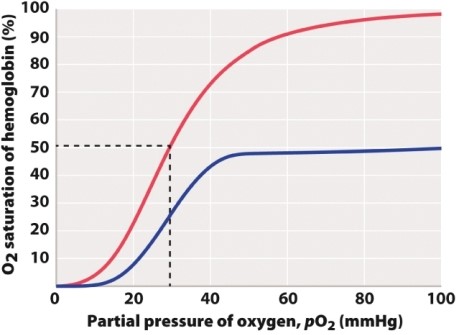
A) decreases the amount of O2 in the air.
B) decreases the amount of hemoglobin.
C) decreases the amount of O2 that can bind to hemoglobin.
Correct Answer:
Verified
Q44: Which of the following occurs during exhalation?
A)Negative
Q45: Ventilation only refers to the movement of
Q46: Which of the following describes the CORRECT
Q47: At any given point along the length
Q48: During heavy exercise, the pO2 in muscle
Q50: A researcher has sectioned a mouse embryo,
Q51: The most important factor in the control
Q52: Given the properties of myoglobin shown in
Q53: What percentage of oxygen in the air
Q54: Which of the following statements is FALSE?
A)Decreasing
Unlock this Answer For Free Now!
View this answer and more for free by performing one of the following actions

Scan the QR code to install the App and get 2 free unlocks

Unlock quizzes for free by uploading documents