The illustration below diagrams osmotic (red arrows) and blood pressures (green arrows) as a function of distance along a capillary. This illustration explains why: 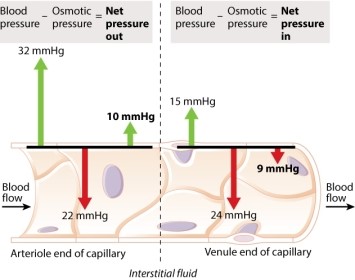
A) diffusion of oxygen takes place in the capillaries.
B) blood flow slows down in the capillaries.
C) protein molecules do not leave the blood vessels.
D) fluid enters the capillary at the arteriole end and leaves at the venule end.
E) fluid leaves the capillary at the arteriole end and reenters at the venule end.
Correct Answer:
Verified
Q94: As fluid moves through a vessel, which
Q95: Baroreceptors are pressure receptors found in the
Q96: Imagine that during her hunt, the same
Q97: Which of the following would NOT
Q98: The muscles of which of the following
Q100: A researcher has introduced molecules of human
Q101: What function do collagen and elastin have
Q102: When stimulated by _ nerves, arterioles supplying
Q103: Which of the following types of blood
Q104: In the disease elephantiasis, lymph vessels become
Unlock this Answer For Free Now!
View this answer and more for free by performing one of the following actions

Scan the QR code to install the App and get 2 free unlocks

Unlock quizzes for free by uploading documents