Which of the following graphs best depicts the relationship between the amount of isometric force (y-axis) produced by a muscle fiber and sarcomere length (x-axis) ? 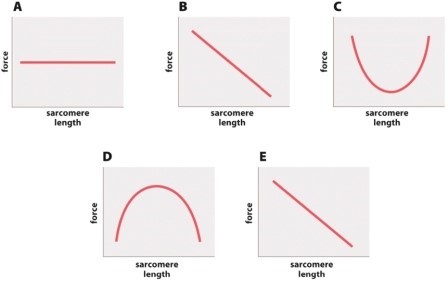
A) graph A
B) graph B
C) graph C
D) graph D
E) graph E
Correct Answer:
Verified
Q37: The combination of a nerve impulse, neurotransmitter
Q38: The functional unit of a muscle cell
Q39: Skeletal muscle contraction is largely dependent on
Q40: You take a human smooth muscle cell
Q41: What role does ATP play in the
Q43: Which of the following is NOT a
Q44: Which of the following statements regarding smooth
Q45: Which of the following statements about muscle
Q46: Muscles can produce forces when shortening and
Q47: Imagine that a researcher has dissected out
Unlock this Answer For Free Now!
View this answer and more for free by performing one of the following actions

Scan the QR code to install the App and get 2 free unlocks

Unlock quizzes for free by uploading documents