As shown in Figure 25.1 below, atmospheric CO2 levels oscillate throughout the year. 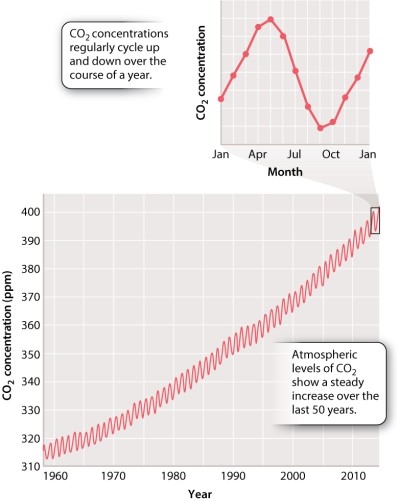 How would this trend change if it were spring for an entire year? Select the graph below that represents the atmospheric CO2 levels of an Earth with a full year of spring (assume you are in the Northern Hemisphere) .
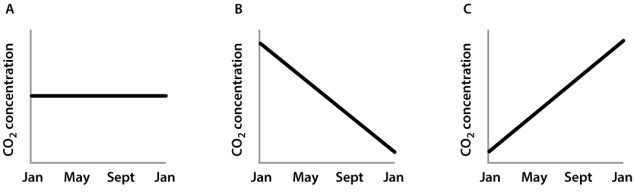
A) graph A
B) graph B
C) graph C
Correct Answer:
Verified
Q1: Which of the following equations is
Q2: Studies assessing the amounts of different carbon
Q4: A positive feedback is one in which
Q5: Which correlates CLOSEST with the net increase
Q6: When looking at the carbon isotopes present
Q7: If plants consume CO2 during photosynthesis, why
Q8: What can Antarctic ice core samples tell
Q9: Which of the following processes are typically
Q10: In reviewing historical records and ice core
Q11: The process of cellular respiration consumes _
Unlock this Answer For Free Now!
View this answer and more for free by performing one of the following actions

Scan the QR code to install the App and get 2 free unlocks

Unlock quizzes for free by uploading documents