The Keeling curve in Figure 25.1, below, shows that while CO2 levels oscillate on an annual basis, overall CO2 levels increase from year to year. 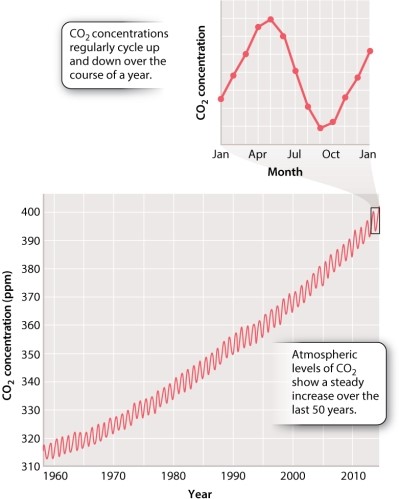 Why has this trend continued in the last 50 years?
A) increasing rates of aerobic respiration associated with the rise in world population
B) decreasing rates of oxygenic photosynthesis by plants and algae
C) clearing of forests to create agricultural land outside the tropics
D) combustion of fossil fuels
Correct Answer:
Verified
Q13: Consider the Keeling curve, which shows a
Q14: Which of the below statements is true
Q15: Over the last several decades, what have
Q16: CO2 is added to the atmosphere by:
A)respiration.
B)photosynthesis.
C)deforestation.
D)the
Q17: It is thought that approximately 90% of
Q19: Why are carbon-based organic compounds, such as
Q20: The levels of CO2 in the atmosphere
Q21: The equation 6CO2 + 6H2O+ C2H12O6 +
Q22: Photosynthesis and respiration both play a major
Q23: The equation C6H12O6 + 6O2
Unlock this Answer For Free Now!
View this answer and more for free by performing one of the following actions

Scan the QR code to install the App and get 2 free unlocks

Unlock quizzes for free by uploading documents