Consider the figure below showing the arrangement of homologous genes in several great apes relative to human chromosome 2. Red and blue lines between chromosomes connect homologous regions. Do these data reject or support the sister group relationship between humans and chimps? 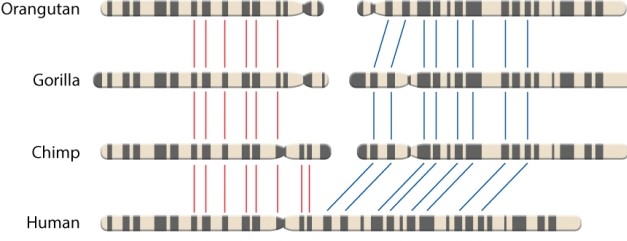 Data source: Yunis, J. J., and O. Prakash. 19 March 1982 "The Origin of Man: A Chromosomal Pictorial Legacy." Science 215:1525-1530.
A) These data reject the sister taxa relationship because humans only have a single chromosome and all other great apes have two; these data cannot be used to infer relatedness.
B) These data reject the sister taxa relationship because all the genes that are connected by the blue lines are the same in all great apes.
C) These data support the sister taxa relationship because all genes indicated by red and blue lines in chimpanzees are also in humans.
D) These data support the sister taxa relationship because it shows how the human chromosome was divided in two to give rise to all other great ape taxa.
Correct Answer:
Verified
Q1: Researchers use the denaturation temperatures of hybrid
Q2: Consider the following diagram: Q3: _ was the first hominin to leave Q5: Humans and chimpanzees last shared a common Q6: Examine Figure 24.2. Q7: As a human, 99% of my _ Q8: Examine Figures 24.1 and 24.2. Q9: Hominins are defined as: Q10: If your nucleotide sequence is 99% the Q11: Examine Figure 24.1. Unlock this Answer For Free Now! View this answer and more for free by performing one of the following actions Scan the QR code to install the App and get 2 free unlocks Unlock quizzes for free by uploading documents![]()
![]()

A)members of species in![]()

