In the graph shown here, the dashed line shows the level of mRNA for a certain protein, Prot1, at various positions along the anterior-posterior axis of an insect embryo. The solid lines portray the levels of two regulatory proteins, A and B, that control translation of the Prot1 mRNA. 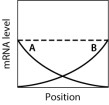 If both A and B repress translation of the Prot1 mRNA, then which graph BEST approximates the expected level of Prot1 across the embryo?
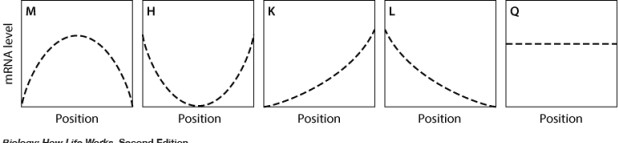
A) graph M
B) graph H
C) graph K
D) graph L
E) graph Q
Correct Answer:
Verified
Q87: Early development in Drosophila includes nuclear division,
Q88: Gap genes:
A)control the differentiation of alternating segments
Q89: An example of gene regulation at the
Q90: In animals, homeotic genes:
A)encode transcription factors.
B)specify the
Q91: Using the natural processes of cell growth
Q93: In the ABC model of floral development,
Q94: In Drosophila development, in which order
Q95: Examine the figure and statements below. Which
Q96: In a normal Drosophila embryo, a gap
Q97: Maternal-effect genes code for _ present in
Unlock this Answer For Free Now!
View this answer and more for free by performing one of the following actions

Scan the QR code to install the App and get 2 free unlocks

Unlock quizzes for free by uploading documents