Which of the following graphs illustrates the relationship between the amount of Bicoid protein and the translation of hunchback mRNA in the Drosophila embryo? 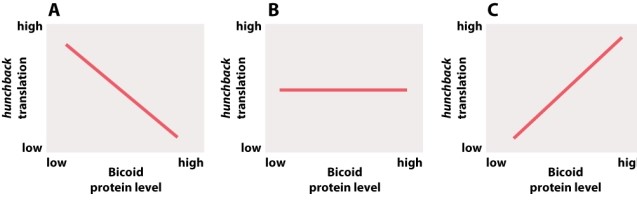
A) graph A
B) graph B
C) graph C
Correct Answer:
Verified
Q121: Imagine that a scientist introduced a copy
Q122: Suppose a researcher discovers a new mutant
Q123: A mutation in a gene that results
Q124: The question of whether animal eyes have
Q125: Which of the following statements about the
Q127: Which one of the following statements about
Q128: The Pax6 gene is evolutionarily conserved among
Q129: Pax6 is a transcription factor that can
Q130: Transcription factors like Pax6 interact with their
Q131: Which statement about diversity in eye development
Unlock this Answer For Free Now!
View this answer and more for free by performing one of the following actions

Scan the QR code to install the App and get 2 free unlocks

Unlock quizzes for free by uploading documents