Which of the graphs below would likely represent the distribution of a simple, single gene trait? 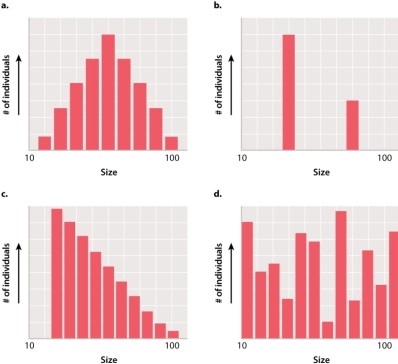
A) graph A
B) graph B
C) graph C
D) graph D
Correct Answer:
Verified
Q5: Inbred lines of animals, such as laboratory
Q6: Which of the following statements BEST reflects
Q7: If the value of the trait in
Q8: Which of the graphs below would likely
Q9: Studies have shown that 5%-10% of all
Q11: A key difference between single gene traits
Q12: Complex traits are often called _ because
Q13: Inbred lines show:
A)no phenotypic variation.
B)phenotypic variation due
Q14: A complex trait can be influenced by
Q15: Consider a simple Mendelian trait that is
Unlock this Answer For Free Now!
View this answer and more for free by performing one of the following actions

Scan the QR code to install the App and get 2 free unlocks

Unlock quizzes for free by uploading documents