In a parent-offspring regression experiment, suggest a hypothesis that could explain the solid line in the following graph. 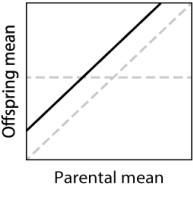
A) The offspring have a "worse" environment than the parents did.
B) The offspring have a "better" environment than the parents did.
C) The trait has a heritability that is less than 0.
D) The trait has a heritability that is greater than 1.
E) None of the answer options is correct.
Correct Answer:
Verified
Q36: Which of the following traits would you
Q37: Which of the following are quantitative traits?
A)serum
Q38: Salt intake is associated with an increased
Q39: Variation in the effects of the environment
Q40: Traits such as human height, blood pressure,
Q42: Genotype-by-environment interaction means that genetic and environmental
Q43: Red coloration in wheat seeds is a
Q44: Nilsson-Ehle studied the effects of a small
Q45: In a parent-offspring regression experiment, suggest a
Q46: Red coloration in wheat seeds is a
Unlock this Answer For Free Now!
View this answer and more for free by performing one of the following actions

Scan the QR code to install the App and get 2 free unlocks

Unlock quizzes for free by uploading documents