The scatterplots show the relation between the average phenotype of parents (x-axis) and that of their offspring (y-axis) for two traits in a variety of tropical sweet corn. One trait is ear height, which has a heritability of 75%; and the other is ear length, which has a heritability of 25%. To make the axes comparable, for each trait the phenotypic measurement is expressed as a deviation from the overall mean in multiples of the standard deviation. Which of the following matchups is CORRECT? 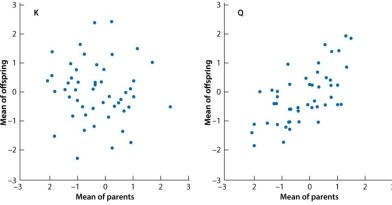
A) Ear length is trait K and ear height is trait Q.
B) Ear length is trait Q and ear height is trait K.
C) Ear length and ear height are both trait K.
D) Ear length and ear height are both trait Q.
Correct Answer:
Verified
Q72: In which of the complex traits shown
Q73: In the graph of Galton's height data
Q74: Which of the traits depicted here illustrates
Q75: When heritability is 100%, the environment plays:
A)no
Q76: Which of the traits depicted here has
Q78: When the average weight of the parents
Q79: Regression toward the mean is observed because
Q80: Heritability is a measure of:
A)dominance.
B)epistasis.
C)concordance.
D)recombination.
E)None of the
Q81: _ of a trait in a population
Q82: If genetically different strains of corn are
Unlock this Answer For Free Now!
View this answer and more for free by performing one of the following actions

Scan the QR code to install the App and get 2 free unlocks

Unlock quizzes for free by uploading documents