Francis Galton, a contemporary of Charles Darwin, studied variation in complex traits such as human height. Use the bar graphs shown below to answer the following question: Which of the following statements BEST describes graph (a) , which depicts Galton's data showing distribution of offspring height from the tallest parents he studied? 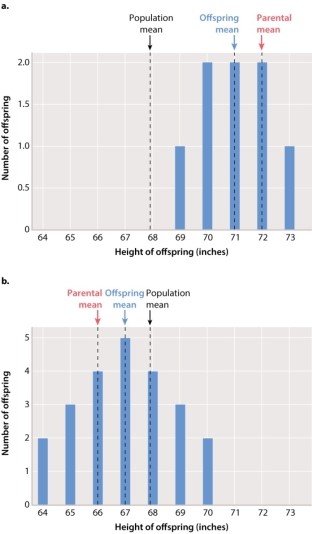
A) The parental mean for the tallest parents is larger than the mean height of their offspring.
B) The parental mean for the tallest parents is smaller than the mean height of their offspring.
C) The average height of the offspring from the tallest parents is not related to the average height of their parents.
D) The average height of the tallest parents is not much more than the population mean height.
Correct Answer:
Verified
Q95: Which of the following statements is TRUE
Q96: An example of "regression toward the mean"
Q97: The data in the graph below show
Q98: Consider a trait determined entirely by
Q99: A trait with high heritability responds rapidly
Q101: Consider a trait determined entirely by environmental
Q102: The data in the table below
Q103: Using identical twins to study heritability is
Q104: The data in the table below
Q105: Consider a trait determined by a rare
Unlock this Answer For Free Now!
View this answer and more for free by performing one of the following actions

Scan the QR code to install the App and get 2 free unlocks

Unlock quizzes for free by uploading documents