Francis Galton, a contemporary of Charles Darwin, studied variation in complex traits such as human height. Use the bar graphs shown below to answer the following question: Which of the following statements best describes Figure 18.7 graph (b) , which depicts Galton's data showing distribution of offspring height from the shortest parents he studied? 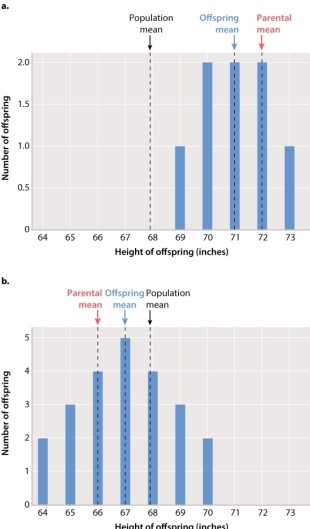
A) The parental mean for the shortest parents is larger than the mean height of their offspring.
B) The parental mean for the shortest parents is smaller than the mean height of their offspring.
C) Offspring from the shortest parents are taller than most members of the population.
D) The average height of the shortest parents is greater than the mean height of the population.
E) None of the answer options is correct.
Correct Answer:
Verified
Q84: The overall results represented in Figure 18.7
Q85: Imagine that one of your good friends
Q86: The magnitude of heritability is an intrinsic
Q87: Heritability applies only to the traits in
Q88: Heritability in nonscientific terms means "the capability
Q90: If all of the variation in a
Q91: If all of the variation in a
Q92: A scientist measured heritability in yield per
Q93: When heritability is 0%, genes play:
A)no role
Q94: Consider a trait determined entirely by environmental
Unlock this Answer For Free Now!
View this answer and more for free by performing one of the following actions

Scan the QR code to install the App and get 2 free unlocks

Unlock quizzes for free by uploading documents