The diagrams below depict the relative proportions of individuals affected with a certain condition (shaded bar) and individuals not affected (open bar) , in individuals carrying either the A-T or the G-C allele of an SNP polymorphism. (Heterozygous genotypes carry both alleles and are included in both categories.) 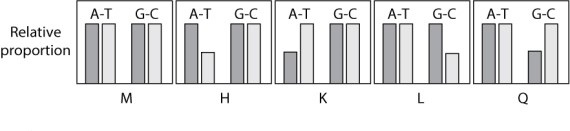 Which graph shows a pattern that suggests that the G-C allele is a risk factor for the disease?
A) graph M
B) graph H
C) graph K
D) graph L
E) graph Q
Correct Answer:
Verified
Q106: What is a single-nucleotide polymorphism?
A)any point mutation
B)the
Q107: In the human copy-number variation (CNV) for
Q108: What kind of genetic variation can alter
Q109: What is the approximate percentage of the
Q110: The diagrams below depict the relative proportions
Q112: Which of the following statements about single-nucleotide
Q113: It is impossible to override a genetic
Q114: SNP stands for:
A)single-nucleotide polymorphism.
B)several nucleotide polymorphism.
C)single nonrecombinant
Q115: A mutation in the BRCA1 gene is
Q116: In the human genome, the least frequent
Unlock this Answer For Free Now!
View this answer and more for free by performing one of the following actions

Scan the QR code to install the App and get 2 free unlocks

Unlock quizzes for free by uploading documents