Each curve in the graph below shows the proportion of amino acid differences between a protein in two species that diverged from a common ancestral species. Which curve represents what would be expected if the protein were evolving according to a molecular clock? 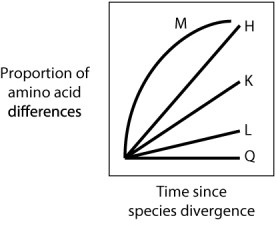
A) curve M
B) curve H
C) curve K
D) curve L
E) curve Q
Correct Answer:
Verified
Q149: DNA ligase is responsible for repairing thymine
Q150: DNA polymerase is responsible for the process
Q151: If a covalent bond joining adjacent nucleotides
Q152: If a cytosine base in DNA is
Q153: Incorrectly repaired double-stranded breaks in DNA can
Q155: Mismatch repair, base excision repair, and nucleotide
Q156: What is the difference between mismatch repair
Q157: A photon of ultraviolet light hits double-stranded
Q158: Which of the following enzymes is responsible
Q159: The enzyme _ repairs 99% of mismatched
Unlock this Answer For Free Now!
View this answer and more for free by performing one of the following actions

Scan the QR code to install the App and get 2 free unlocks

Unlock quizzes for free by uploading documents