Multiple Choice
IS Graph 1 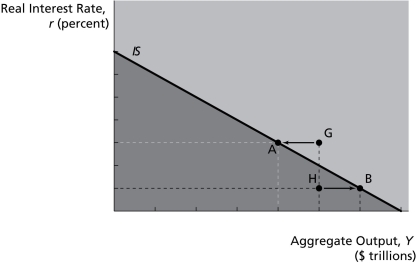
-On the graph above,assuming that G = 0 and NX = 0,saving is above planned investment at point ________.
A) A
B) B
C) G
D) H
E) none of the above
Correct Answer:
Verified
Related Questions
Q43: If planned expenditure is below output,as the
Q44: IS Curve Exogenous Variables and Parameters
Table 1
Q45: In the IS equation,which of the following
Q46: We may infer from the downward slope
Q47: If planned expenditure is below output,as the
Q49: IS Graph 1 Q50: The IS curve _.![]()
A)shifts to the right
Unlock this Answer For Free Now!
View this answer and more for free by performing one of the following actions

Scan the QR code to install the App and get 2 free unlocks

Unlock quizzes for free by uploading documents