Multiple Choice
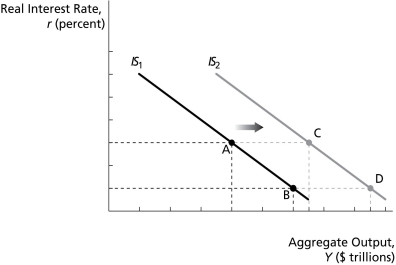
IS Graph 2 
-On the graph above,if the U.S.economy is at point B in 2009,then the economy in 2010 is best represented by point ________.
A) A
B) B
C) C
D) D
E) any of the labeled points is as good as the others
Correct Answer:
Verified
Related Questions
Q87: The IS model implies that a dollar
Q88: In a stock market boom _.
A)autonomous consumption
Q89: Assume that households decide to save more,so
Q90: A decrease in autonomous investment _.
A)decreases equilibrium
Q91: IS Graph 2 Q92: In a stock market boom _.![]()
A)government spending
Unlock this Answer For Free Now!
View this answer and more for free by performing one of the following actions

Scan the QR code to install the App and get 2 free unlocks

Unlock quizzes for free by uploading documents