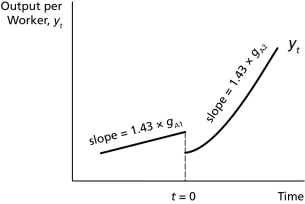
-The graph above might represent the ________.
A) response to an increase in the fraction of the population engaged in research and development
B) response to a rise in the productiveness of research and development
C) response to an increase in the total population
D) response to a rise in the saving rate
Correct Answer:
Verified
Q64: Technological spillover _.
A)is made possible by the
Q65: Endogenous growth theory supports the conclusion that
Q66: According to the Romer model,an increase in
Q67: Spending on education is likely to raise
Q68: An economy of 80 million people has
Q70: According to the Romer model,tax incentives to
Q71: The Romer and Solow models reach the
Q72: The current world population is more than
Q73: When technology improves in a country with
Q74: The observation that countries with high rates
Unlock this Answer For Free Now!
View this answer and more for free by performing one of the following actions

Scan the QR code to install the App and get 2 free unlocks

Unlock quizzes for free by uploading documents