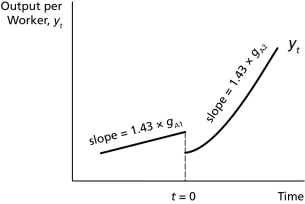
-On the graph above,for a while after t = 0,the growth rate of output per worker is ________ the growth rate prior to time zero,and ________.
A) below;rising
B) below;falling
C) above;constant
D) above;falling
Correct Answer:
Verified
Q58: Because old ideas are an input in
Q59: The quote,"If I have seen farther than
Q60: The Romer model is distinct from the
Q61: In the Romer model,as more labor is
Q62: One difference between a policy of direct
Q64: Technological spillover _.
A)is made possible by the
Q65: Endogenous growth theory supports the conclusion that
Q66: According to the Romer model,an increase in
Q67: Spending on education is likely to raise
Q68: An economy of 80 million people has
Unlock this Answer For Free Now!
View this answer and more for free by performing one of the following actions

Scan the QR code to install the App and get 2 free unlocks

Unlock quizzes for free by uploading documents