Figure 6.1 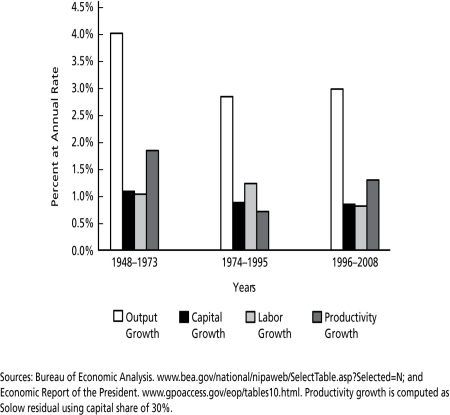
-In Figure 6.1, the post-World War II "baby boom" is reflected in the growth of ________.
A) labor input from 1974 - 1995
B) labor input from 1948 - 1973
C) output from 1948 - 1973
D) capital input from 1996 - 2008
Correct Answer:
Verified
Q20: Figure 6.1 Q21: If depreciation is equal to investment _. Q68: Figure 6.1 Q69: Figure 6.1 Q70: Economic growth _. Q74: Productivity is _. Q76: Which of the following is the most Q77: The slowdown in U.S.economic growth in the Q79: If the contribution from capital and labor Q82: Across national economies which of the following Unlock this Answer For Free Now! View this answer and more for free by performing one of the following actions Scan the QR code to install the App and get 2 free unlocks Unlock quizzes for free by uploading documents![]()
A)![]()
![]()
A)is driven by different elements
A)determined by central bank policy
B)the

