Solow Diagram 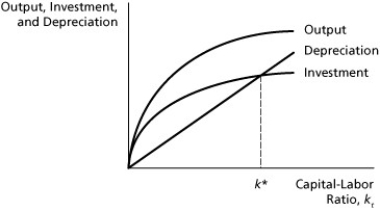
-The diagram above shows a steady state with a constant quantity of labor.Show on the graph how the steady state is determined if the labor force is growing at some constant rate.On the graph,show how to measure the change in consumption per worker that results from growth of the labor force.
Correct Answer:
Answered by Quizplus AI
View Answer
Unlock this answer now
Get Access to more Verified Answers free of charge
Q51: The impact of immigration on an economy's
Q52: On the Solow Diagram,an increase in productivity
Q53: Other things the same,in the Solow model
Q54: According to the Solow model,a benefit of
Q55: Evidence of a negative correlation between income
Q57: If productivity is growing at some sustained
Q58: Output per worker is 50,the saving rate
Q59: Population growth is similar to depreciation,in that
Q60: Consumption per worker is 72,depreciation is 12.5%,and
Q61: If productivity growth equals 3.0 percent,the contribution
Unlock this Answer For Free Now!
View this answer and more for free by performing one of the following actions

Scan the QR code to install the App and get 2 free unlocks

Unlock quizzes for free by uploading documents