The property damage claim frequencies per 100 cars in Massachusetts in the year 2000, 2001, 2002 were 6.87, 7.05, and 7.13, respectively. The corresponding claim frequencies in the United States were 4.1,  and 4.07 respectively. Express this information using a 2×3 matrix.
A) 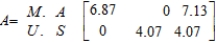
B) 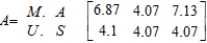
C) 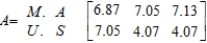
D) 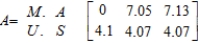
E) 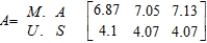
Correct Answer:
Verified
Q169: Find the transpose of the given matrix.
Q170: Perform the indicated operations. Q171: Identify the row matrix. What is its Q172: Identify the square matrix. What is its Q173: Perform the indicated operations. Q175: Find the sizes of A, B, C Q176: Perform the addition. Q177: Solve for u, x, y, and z Q178: Perform the subtraction. Q179: Perform the subtraction. Unlock this Answer For Free Now! View this answer and more for free by performing one of the following actions Scan the QR code to install the App and get 2 free unlocks Unlock quizzes for free by uploading documents![]()
![]()
![]()
![]()
![]()

