A quality analyst wants to construct a sample mean chart for controlling a packaging process.He knows from past experience that the process standard deviation is two ounces.Each day last week,he randomly selected four packages and weighed each.The data from that activity appear below.
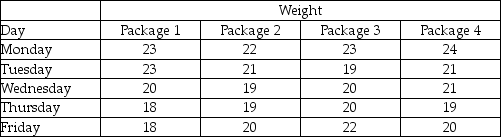 (a)Calculate all sample means and the mean of all sample means.
(b)Calculate upper and lower 2-sigma x-bar chart control limits that allow for natural variations.
(c)Based on the x-bar chart,is this process in control?
Correct Answer:
Verified
View Answer
Unlock this answer now
Get Access to more Verified Answers free of charge
Q57: Which of the following is true of
Q62: A hospital-billing auditor has been inspecting patient
Q64: Examine the Statistical Process Control outputs below.Answer
Q65: The mean and standard deviations for a
Q166: The _-chart is the chief way to
Q175: A nationwide parcel delivery service keeps track
Q179: A run test is used:
A) to examine
Q180: According to the text, what is the
Q186: The width of a bronze bar is
Q192: What is the difference between natural and
Unlock this Answer For Free Now!
View this answer and more for free by performing one of the following actions

Scan the QR code to install the App and get 2 free unlocks

Unlock quizzes for free by uploading documents