Related Questions
Q90: Pareto charts are a graphical way of
Q90: Pareto charts are used to:
A) identify inspection
Q92: If a sample of parts is measured
Q93: A fishbone chart is also known as
Q94: Construct a cause-and-effect diagram for why students
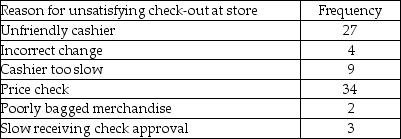
Q94: A customer service manager at a retail
Q95: A cause-and-effect diagram helps identify the sources
Q96: Perform a Pareto analysis on the following
Q102: A professor teaches two sections of a
Q114: _ diagrams use a schematic technique to
Unlock this Answer For Free Now!
View this answer and more for free by performing one of the following actions

Scan the QR code to install the App and get 2 free unlocks

Unlock quizzes for free by uploading documents