Given the following graphs, which graph represents fixed costs? 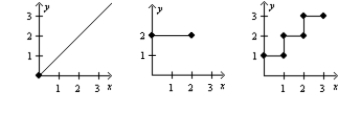

Correct Answer:
Verified
Q16: As the volume of activity increases within
Q61: Each time cumulative volume doubles, _ fall
Q63: A manufacturing company pays an assembly line
Q70: Fixed cost per unit is $7 when
Q74: The direct material cost is $20,000 when
Q74: In a traditional cost management system, cost
Q76: Sandusky Corporation has the following costs for
Q79: Which of the following costs is a
Q82: Figure 3-1
Sonor Systems undertakes its own machine
Q92: The efficient level of activity performance is
Unlock this Answer For Free Now!
View this answer and more for free by performing one of the following actions

Scan the QR code to install the App and get 2 free unlocks

Unlock quizzes for free by uploading documents