The following diagram is a cost-volume-profit graph for a manufacturing company: 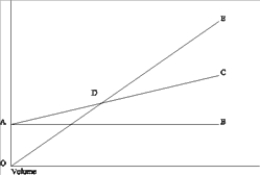 Select the answer that best describes the labeled item on the diagram.
A) Area CDE represents the area of net loss.
B) Line AC graphs total fixed costs.
C) Point D represents the point at which the contribution margin per unit increases.
D) Line AC graphs total costs.
Correct Answer:
Verified
Q12: On a profit-volume graph, the profit line
Q22: Sales mix refers to
A) the different volume
Q26: Cost-volume-profit models assume that
A)the sales mix may
Q69: Victoria Company produces two products, X and
Q71: In multiple-product analysis, direct fixed costs are
A)fixed
Q73: Assume the following cost behavior data for
Q75: Hologram Printing Company projected the following information
Q78: Tiramisu Company projected the following information for
Q79: Assume the following cost behavior data for
Q81: In a cost-volume-profit graph, the total revenue
Unlock this Answer For Free Now!
View this answer and more for free by performing one of the following actions

Scan the QR code to install the App and get 2 free unlocks

Unlock quizzes for free by uploading documents