The following diagram is a cost-volume-profit graph for a manufacturing company: 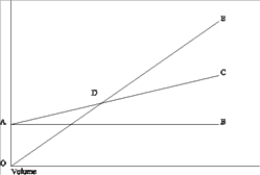 The formula to determine the Y-axis value ($) at point D on the graph is
A) Fixed costs + (Variable costs per unit × Number of units) .
B) ΣXY - bΣX.
C) Fixed costs/Unit contribution margin.
D) Fixed costs/Contribution margin ratio.
Correct Answer:
Verified
Q21: On a profit-volume graph, the intersection of
Q22: Which of the following assumptions does NOT
Q30: When a company sells more units than
Q36: A profit-volume graph
A)measures profit or loss on
Q92: The DesMaris Company had the following income
Q94: Nonesuch Company sells only one product at
Q99: The income statement for Symbiosis Manufacturing Company
Q101: The Solemn Company has an operating leverage
Q102: The Mildmanner Corporation has the following data
Q104: Assuming all other things are the same,
Unlock this Answer For Free Now!
View this answer and more for free by performing one of the following actions

Scan the QR code to install the App and get 2 free unlocks

Unlock quizzes for free by uploading documents