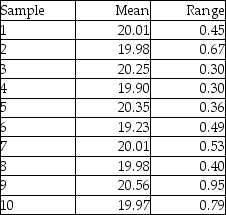
Ten samples of size four were taken from a process,and their weights measured.The sample averages and sample ranges are in the following table.Construct and plot an x-bar and R-chart using these data.Is the process in control?
Correct Answer:
Verified
View Answer
Unlock this answer now
Get Access to more Verified Answers free of charge
Q62: A hospital-billing auditor has been inspecting patient
Q65: The mean and standard deviations for a
Q67: Cartons of Plaster of Paris are supposed
Q70: A quality analyst wants to construct a
Q70: The defect rate for a product has
Q74: A quality analyst wants to construct a
Q76: McDaniel Shipyards wants to develop a control
Q78: An operator trainee is attempting to monitor
Q183: Why do range charts exist? Aren't x-bar
Q200: A local manufacturer supplies you with parts,
Unlock this Answer For Free Now!
View this answer and more for free by performing one of the following actions

Scan the QR code to install the App and get 2 free unlocks

Unlock quizzes for free by uploading documents