Use the data and graph shown below for the following questions. 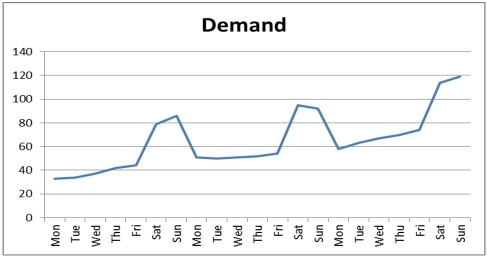
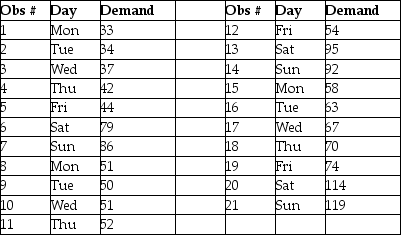
-Refer to the instruction above.Use a trend projection to forecast the next week's demand.Then apply seasonal indices to determine the demand on Saturday of the fourth week.What is the demand projected to be?
A) 141.4
B) 146.2
C) 151.3
D) 158.9
Correct Answer:
Verified
Q38: _ methods of forecasting translate the opinions
Q54: _ is a systematic approach to determine
Q83: _ are assumed to "cause" the results
Q135: Table 14.13
The manager of a pizza shop
Q136: Table 14.13
The manager of a pizza shop
Q137: Use the data and graph shown below
Q138: Table 14.13
The manager of a pizza shop
Q139: Use the data and graph shown below
Q140: A(n) _ is a portion of data
Q145: _ are often the result of neglecting
Unlock this Answer For Free Now!
View this answer and more for free by performing one of the following actions

Scan the QR code to install the App and get 2 free unlocks

Unlock quizzes for free by uploading documents