This figure represents the impact of supply chain performance on total costs.Use it to answer the next two questions. 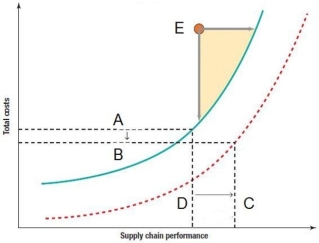
-Refer to the figure above.The movement from point A to point B indicates the:
A) increase in time it takes for your firm to deliver goods and services.
B) decrease in time it takes for your firm to deliver goods and services.
C) increase in cost.
D) decrease in cost.
Correct Answer:
Verified
Q1: A typical manufacturer spends:
A) about 25% of
Q20: Henderson Corporation is a supplier of alloy
Q26: Maple Leaf,Inc. ,a television manufacturer,would like to
Q27: This figure represents the impact of supply
Q28: Some discount stores are able to sell
Q29: Padco averages $15 million worth of inventory
Q32: Which one of the following statements about
Q51: A producer of medical devices makes a
Q51: Which of the following is NOT identified
Q59: A firm may choose to use members
Unlock this Answer For Free Now!
View this answer and more for free by performing one of the following actions

Scan the QR code to install the App and get 2 free unlocks

Unlock quizzes for free by uploading documents