The break-even graph shown below represents the cost structure associated with a flexible production process and one that is fixed (less flexible).Using the information displayed in the graph,determine the cost structures associated with the two alternative production methods. 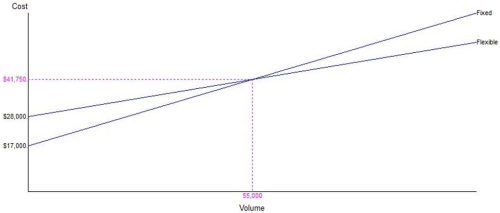
Correct Answer:
Verified
View Answer
Unlock this answer now
Get Access to more Verified Answers free of charge
Q33: A(n) _ allocates space and indicates placement
Q44: List and briefly define four different basic
Q52: Describe the differences among make-to-order, assemble-to-order, and
Q62: Two manufacturing processes are being considered for
Q73: An entrepreneur considers three possibilities for the
Q96: Comment on the need for flexibility in
Q99: Define economies of scope, and identify how
Q140: Name four other business functions within a
Q144: What is the meaning of process reengineering
Q145: A firm of four departments has the
Unlock this Answer For Free Now!
View this answer and more for free by performing one of the following actions

Scan the QR code to install the App and get 2 free unlocks

Unlock quizzes for free by uploading documents