The following figure shows the demand and cost curves facing a firm with market power in the short run. 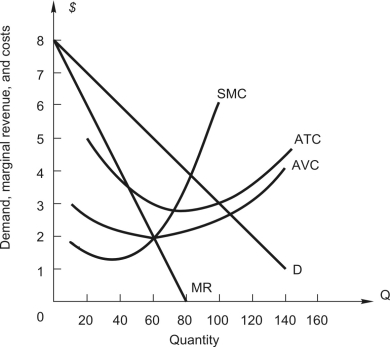 The profit-maximizing level of output is
A) 60 units.
B) 70 units
C) 80 units
D) 90 units.
E) 100 units.
Correct Answer:
Verified
Q2: In a monopolistically competitive market,
A)a firm has
Q14: Refer to the following table showing a
Q15: monopolistic competitor is similar to a monopolist
Q16: Refer to the following table showing a
Q17: a monopolistically competitive market,
A)firms are small relative
Q18: Refer to the following figure showing demand
Unlock this Answer For Free Now!
View this answer and more for free by performing one of the following actions

Scan the QR code to install the App and get 2 free unlocks

Unlock quizzes for free by uploading documents