The following figure shows the demand and cost curves facing a firm with market power in the short run. 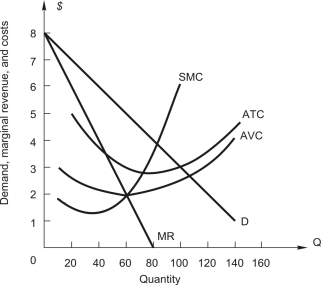 The firm earns profits of
A) $ 75.
B) $120.
C) $150.
D) $180.
E) $300.
Correct Answer:
Verified
Q4: Q5: a monopoly market, Q7: monopolist Q10: firm with market power Q11: method of measuring the extent of a Q13: Monopolistic competition is similar to perfect competition Q13: Refer to the following figure showing demand Q14: Refer to the following table showing a Q15: Which of the following would indicate a Q18: A monopoly is producing a level of![]()
A)other firms have no incentive
A)can raise its price without losing any
A)can increase price without
Unlock this Answer For Free Now!
View this answer and more for free by performing one of the following actions

Scan the QR code to install the App and get 2 free unlocks

Unlock quizzes for free by uploading documents