Multiple Choice
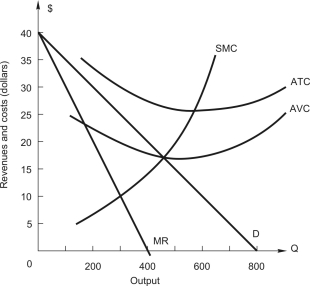 The figure above shows the demand and cost curves facing a price-setting firm.The profit-maximizing or loss-minimizing) level of output is
A) 100
B) 200
C) 300
D) 400
E) 450
Correct Answer:
Verified
Related Questions
Q21: Q24: Refer to the following table which gives Q26: Which of the following is true of Q27: Columns 1 and 2 make up a Q28: Refer to the following table which gives Q29: A monopolist will maximize profit by producing![]()
Unlock this Answer For Free Now!
View this answer and more for free by performing one of the following actions

Scan the QR code to install the App and get 2 free unlocks

Unlock quizzes for free by uploading documents