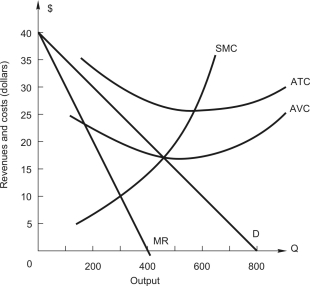
 The figure above shows the demand and cost curves facing a price-setting firm.In profit-maximizing or loss-minimizing) equilibrium,the price-setting firm earns $______ in total revenue,which is ___________ the maximum possible total revenue of $________.
A) $7,500; equal to; $7,500
B) $8,000; more than; $7,500
C) $7,650; less than; $8,000
D) $8,000; equal to; $8,000
E) $7,500; less than; $8,000
Correct Answer:
Verified
Q22: A firm with market power will maximize
Q28: A firm with market power is producing
Q30: Suppose that a profit-maximizing monopolist has a
Q31: Columns 1 and 2 make up a
Q34: A profit-maximizing firm with market power will
Q37: Columns 1 and 2 make up a
Unlock this Answer For Free Now!
View this answer and more for free by performing one of the following actions

Scan the QR code to install the App and get 2 free unlocks

Unlock quizzes for free by uploading documents