Multiple Choice
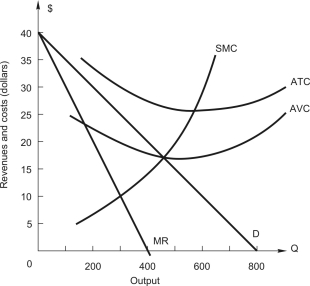 The figure above shows the demand and cost curves facing a price-setting firm.In profit-maximizing or loss-minimizing) equilibrium,the Lerner index is _____,and the elasticity of demand is ______.
A) 1 ;-1
B) 0.6; -1.667
C) 0.5; -2.0
D) 0.667; -1.5
E) 1.33; -0.75
Correct Answer:
Verified
Related Questions
Unlock this Answer For Free Now!
View this answer and more for free by performing one of the following actions

Scan the QR code to install the App and get 2 free unlocks

Unlock quizzes for free by uploading documents