The graph below on the left shows the short-run marginal cost curve for a typical firm selling in a perfectly competitive industry.The graph on the right shows current industry demand and supply. 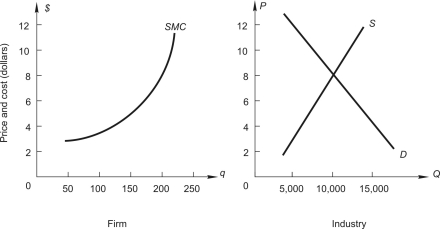 What output should the firm produce?
A) 200
B) 250
C) 150
D) 300
Correct Answer:
Verified
Q2: Below,the graph on the left shows the
Q4: Below,the graph on the left shows the
Q5: Total cost schedule for a competitive firm:
Q5: Firm A and firm B both have
Q6: The graph below shows demand and marginal
Q8: Below,the graph on the left shows the
Q9: a perfectly competitive market
A)a firm must lower
Q9: Which of the following is NOT a
Q13: A competitive firm will maximize profit by
Q17: When total fixed costs increase,
A)the profit-maximizing level
Unlock this Answer For Free Now!
View this answer and more for free by performing one of the following actions

Scan the QR code to install the App and get 2 free unlocks

Unlock quizzes for free by uploading documents