Below,the graph on the left shows long-run average and marginal cost for a typical firm in a perfectly competitive industry.The graph on the right shows demand and long-run supply for an increasing-cost industry. 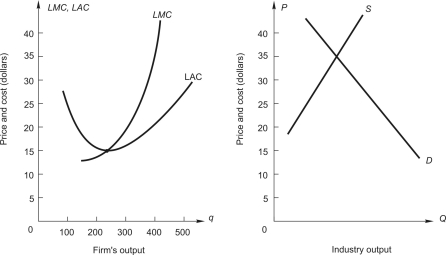 If this were a constant-cost industry,what would be the price when the industry gets to long-run competitive equilibrium?
A) between $35 and $20
B) $35
C) $20
D) below $20
E) above $35
Correct Answer:
Verified
Q44: Suits Only,a dry cleaning firm that specializes
Q46: Q47: To answer the question,refer to the following Q48: Suits Only,a dry cleaning firm that specializes Q48: Firms that employ exceptionally productive resources Q51: Below,the graph on the left shows long-run Unlock this Answer For Free Now! View this answer and more for free by performing one of the following actions Scan the QR code to install the App and get 2 free unlocks Unlock quizzes for free by uploading documents![]()
A)have lower

