The following graph shows the marginal and average product curves for labor,the firm's only variable input.The monthly wage for labor is $2,800.Fixed cost is $160,000. 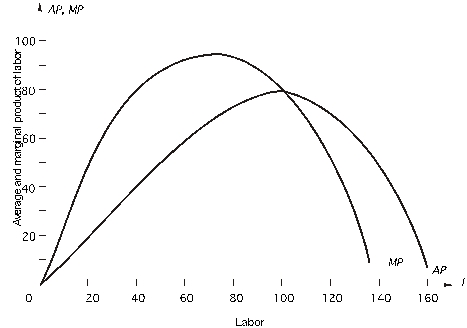 At what output does the firm reach minimum average variable cost?
A) 7,400
B) 8,000
C) 100
D) 6,000
E) 600
Correct Answer:
Verified
Q82: Q83: The capital stock is fixed at 50 Q84: Q85: The capital stock is fixed at 50 Q86: The following graph shows the marginal and Q88: The following graph shows the marginal and Q89: The following graph shows the marginal and Q90: The following graph shows the marginal and Q91: To answer,refer to the following: "Ford built Q92: The following graph shows the marginal and![]()
![]()
Unlock this Answer For Free Now!
View this answer and more for free by performing one of the following actions

Scan the QR code to install the App and get 2 free unlocks

Unlock quizzes for free by uploading documents