The following graph shows the marginal and average product curves for labor,the firm's only variable input.The monthly wage for labor is $2,800.Fixed cost is $160,000. 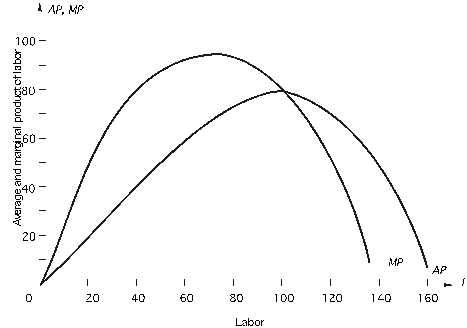 When the firm uses 120 units of labor,how much output does it produce?
A) 7,000 units
B) 70 units
C) 8,400 units
D) 9,200 units
E) 7,500 units
Correct Answer:
Verified
Q90: The following graph shows the marginal and
Q91: To answer,refer to the following: "Ford built
Q92: The following graph shows the marginal and
Q93: To answer,refer to the following: "Ford built
Q94: The following graph shows the marginal and
Q95: The following graph shows the marginal and
Q96: The capital stock is fixed at 50
Q98: The capital stock is fixed at 50
Q99: To answer,refer to the following: "At Huffy's
Q100: To answer,refer to the following: "At Huffy's
Unlock this Answer For Free Now!
View this answer and more for free by performing one of the following actions

Scan the QR code to install the App and get 2 free unlocks

Unlock quizzes for free by uploading documents