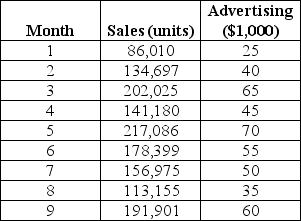
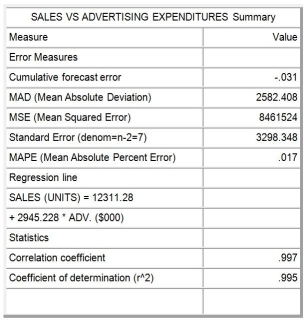
The marketing department for a major manufacturer tracks sales and advertising expenditures each month.Data from the past nine months and regression output appear in the following table.Interpret the equation coefficients and the values for the coefficient of determination and the correlation coefficient.
 Created by POM-QM for Windows
Correct Answer:
Verified
Y = a + bX
S...
View Answer
Unlock this answer now
Get Access to more Verified Answers free of charge
Q83: _ are assumed to "cause" the results
Q86: The _ variable is the variable that
Q88: _ is a causal method of forecasting
Q95: The naive forecast may be adapted to
Q95: Which one of the following statements about
Q98: It is now near the end of
Q99: Demands for a newly developed salad bar
Q101: Which statement about forecast accuracy is TRUE?
A)A
Q106: Table 8.7
A sales manager wants to forecast
Q108: Graph 8.1
Data plotted in the graph appear
Unlock this Answer For Free Now!
View this answer and more for free by performing one of the following actions

Scan the QR code to install the App and get 2 free unlocks

Unlock quizzes for free by uploading documents