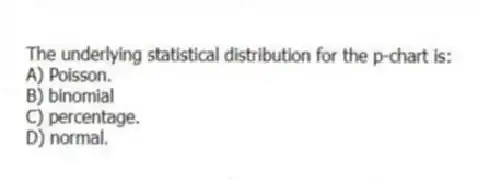
The underlying statistical distribution for the p-chart is:
A) Poisson.
B) binomial
C) percentage.
D) normal.
Correct Answer:
Verified
Q83: An operator of a filling machine plotted
Q84: The UCL and LCL for an
Q85: An example of a type II error
Q86: An example of a type I error
Q87: Which one of the following statements relating
Q89: A sampling plan is best for evaluating
Q90: Process centering is shown by an
Q91: Regarding control charts, changing from three-sigma limits
Q92: Which of the following would be a
Q93: Which one of the following statements about
Unlock this Answer For Free Now!
View this answer and more for free by performing one of the following actions

Scan the QR code to install the App and get 2 free unlocks

Unlock quizzes for free by uploading documents