Construct a 3-sigma R-chart for the length in centimeters of a part from the following table.What is the upper control limit of your R-chart? 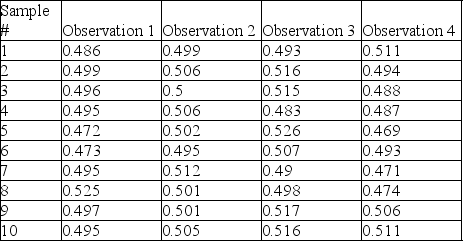
A) .032
B) 0.51
C) 0.73
D) 2.28
Correct Answer:
Verified
Q83: An operator of a filling machine plotted
Q88: The underlying statistical distribution for the p-chart
Q89: A sampling plan is best for evaluating
Q92: Which of the following would be a
Q95: In SPC, the distribution of sample means:
A)
Q101: The defect rate for a product has
Q103: Table 5.11
Factors for Calculating Three-Sigma Limits for
Q104: Construct a 3-sigma x-bar chart for the
Q105: A company is interested in monitoring the
Q114: The defect rate for a product has
Unlock this Answer For Free Now!
View this answer and more for free by performing one of the following actions

Scan the QR code to install the App and get 2 free unlocks

Unlock quizzes for free by uploading documents