Construct 3 control charts using the data in the table.What conclusions can you draw about the state of control for this process? 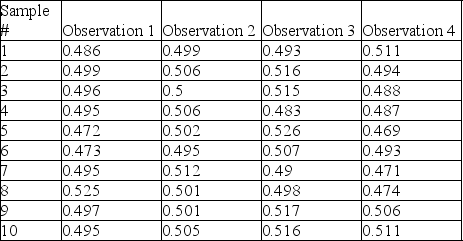
A) X bar chart is out of control but the R-chart is in control
B) the X bar chart is out of control and the R chart is also out of control
C) the X bar chart and the R chart are both in control
D) the X bar chart is in control but the R chart is out of control
Correct Answer:
Verified
Q105: The consultant suspiciously eyed the c-chart that
Q107: Historically, the average proportion of defective bars
Q110: The defect rate for a product has
Q111: Table 5.11
Factors for Calculating Three-Sigma Limits for
Q112: Table 5.11
Factors for Calculating Three-Sigma Limits for
Q113: Five samples of size 4 were taken
Q115: A company is interested in monitoring the
Q117: Historically,the average time to service a customer
Q117: Which alternative will increase the probability of
Q119: Historically,the average time to service a customer
Unlock this Answer For Free Now!
View this answer and more for free by performing one of the following actions

Scan the QR code to install the App and get 2 free unlocks

Unlock quizzes for free by uploading documents