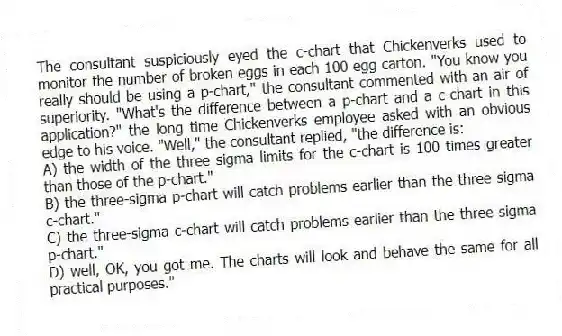
The consultant suspiciously eyed the c-chart that Chickenverks used to monitor the number of broken eggs in each 100 egg carton. "You know you really should be using a p-chart," the consultant commented with an air of superiority. "What's the difference between a p-chart and a c-chart in this application?" the long time Chickenverks employee asked with an obvious edge to his voice. "Well," the consultant replied, "the difference is:
A) the width of the three sigma limits for the c-chart is 100 times greater than those of the p-chart."
B) the three-sigma p-chart will catch problems earlier than the three sigma c-chart."
C) the three-sigma c-chart will catch problems earlier than the three sigma p-chart."
D) well, OK, you got me. The charts will look and behave the same for all practical purposes."
Correct Answer:
Verified
Q100: Regarding control charts, a type I error
Q101: The defect rate for a product has
Q102: A company is interested in monitoring
Q103: Table 5.11
Factors for Calculating Three-Sigma Limits
Q104: Table 5.11
Factors for Calculating Three-Sigma Limits
Q106: Five samples of size 4 were
Q107: Historically, the average proportion of defective bars
Q108: Historically, the average time to service
Q109: A company is interested in monitoring
Q110: The defect rate for a product has
Unlock this Answer For Free Now!
View this answer and more for free by performing one of the following actions

Scan the QR code to install the App and get 2 free unlocks

Unlock quizzes for free by uploading documents