Table 5.3
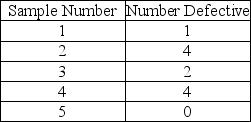
-Four samples of 100 each were taken from an assembly line,with the following results: 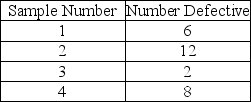 Using the historical average as the central line of the chart,which one of the following is the limit for an attributes control chart with z = 2?
A) UCL > 0.1 and LCL > 0.03
B) UCL > 0.1 and LCL < 0.03
C) UCL < 0.1 and LCL > 0.03
D) UCL < 0.1 and LCL < 0.03
Correct Answer:
Verified
Q122: The poultry farmer was aghast when the
Q124: If an x-bar chart is constructed using
Q125: Jerry watched in awe as Warren went
Q128: _ of variation include any variation-causing factors
Q131: The UCL and LCL for an
Q131: Table 5.4
The manager of Champion Cooling Company
Q134: A hotel tracks the number of complaints
Q135: A hotel tracks the number of complaints
Q138: Table 5.4
The manager of Champion Cooling Company
Q140: A hotel tracks the number of complaints
Unlock this Answer For Free Now!
View this answer and more for free by performing one of the following actions

Scan the QR code to install the App and get 2 free unlocks

Unlock quizzes for free by uploading documents