The break-even graph shown below represents the cost structure associated with a flexible production process and one that is fixed (less flexible).Using the information displayed in the graph,determine the cost structures associated with the two alternative production methods. 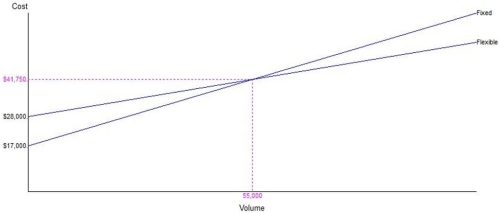
Correct Answer:
Verified
View Answer
Unlock this answer now
Get Access to more Verified Answers free of charge
Q61: _ automation can handle various products through
Q66: Scenario 2.6
You currently purchase a part used
Q68: Higher volume in a process is generally
Q76: Which statement about economies of scope is
Q76: _ reflects the ways in which customers
Q80: Which of the following statements regarding resource
Q81: Which one of the following statements concerning
Q84: One method for a factory to gain
Q87: More often than not, process improvement takes
Q89: Process improvement teams that focus on processes
Unlock this Answer For Free Now!
View this answer and more for free by performing one of the following actions

Scan the QR code to install the App and get 2 free unlocks

Unlock quizzes for free by uploading documents