A restaurant manager tracks complaints from the diner satisfaction cards that are turned in at each table.The data collected from the past week's diners appear in the following table. 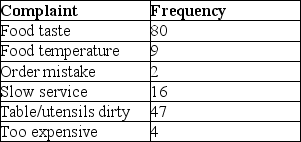 Using a classic Pareto analysis,what categories comprise about 20% of the total complaints?
A) Order mistake,Too expensive,Food temperature,Slow service
B) Slow service,Order mistake
C) Food taste,Food temperature,Slow service
D) Food taste,Table/utensils dirty
Correct Answer:
Verified
Q81: _ involves estimating the proportion of time
Q163: A farmer that has been well-trained in
Q182: The _ in a service blueprint separates
Q188: A(n) _ is a bar chart on
Q193: A(n) _ is a diagram that relates
Q194: Which of the following analyses is BEST
Q195: The sales team has just finished creating
Q197: A restaurant manager tracks complaints from the
Q198: A(n) _ shows processing steps grouped according
Q199: How can flowcharts and process charts be
Unlock this Answer For Free Now!
View this answer and more for free by performing one of the following actions

Scan the QR code to install the App and get 2 free unlocks

Unlock quizzes for free by uploading documents