A quality analyst wants to construct a sample mean chart for controlling a packaging process.He knows from past experience that when the process is operating as intended,packaging weight is normally distributed with a mean of twenty ounces,and a process standard deviation of two ounces.Each day last week,he randomly selected four packages and weighed each.The data from that activity appears below. 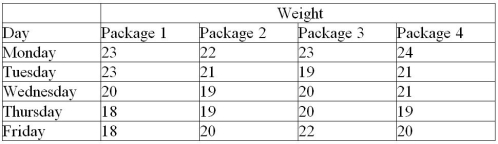 (a)If he sets an upper control limit of 21 and a lower control limit of 19 around the target value of twenty ounces,what is the probability of concluding that this process is out of control when it is actually in control?
(b)With the UCL and LCL of part a,what do you conclude about this process-is it in control?
Correct Answer:
Verified
View Answer
Unlock this answer now
Get Access to more Verified Answers free of charge
Q119: Examine the Statistical Process Control outputs below.Answer
Q122: Pierre's Motorized Pirogues and Mudboats is setting
Q123: McDaniel Shipyards wants to develop control charts
Q125: Pierre's Motorized Pirogues and Mudboats is setting
Q127: A part that connects two levels should
Q129: Pierre's Motorized Pirogues and Mudboats is setting
Q132: The mean and standard deviations for a
Q140: A local manufacturer supplies you with parts,
Q186: The width of a bronze bar is
Q251: The _ is the lowest level of
Unlock this Answer For Free Now!
View this answer and more for free by performing one of the following actions

Scan the QR code to install the App and get 2 free unlocks

Unlock quizzes for free by uploading documents